
The dashboard
localhost:3030 is the visual face of your knowledge graph — Explorer, Insights, Fleet, and Cortex, plus a live query-quota meter.
memtrace start serves an HTTP API and a dashboard on port 3030. It's the same graph your MCP tools query, rendered as a live picture instead of a tool response — four top-level views: Explorer, Insights, Fleet, and Cortex.
Overview#
$ memtrace start
# opens http://localhost:3030 once indexing is underway
Use --headless to keep the API and dashboard serving without opening a browser tab — the right choice for CI runners and agent hosts that don't need the visual.
Explorer#
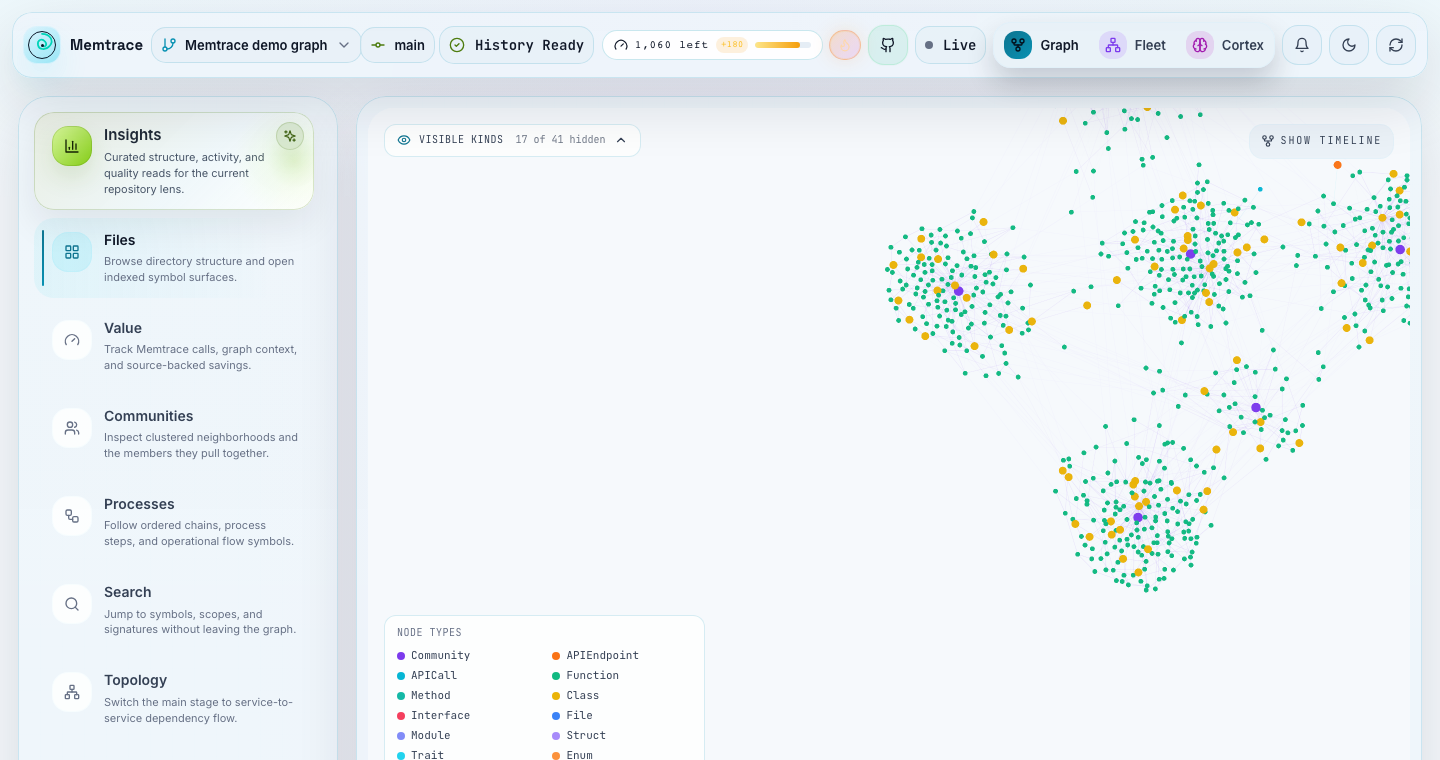
Explorer is the default page: an interactive graph canvas of your indexed code, with a sidebar of six tabs, a node inspector, and a temporal timeline along the bottom.
Sidebar tabs
- Files — browse the directory structure and open indexed symbol surfaces. With a single repo selected, use Add to .memtraceignore to append a path and evict it from the live graph — see .memtraceignore.
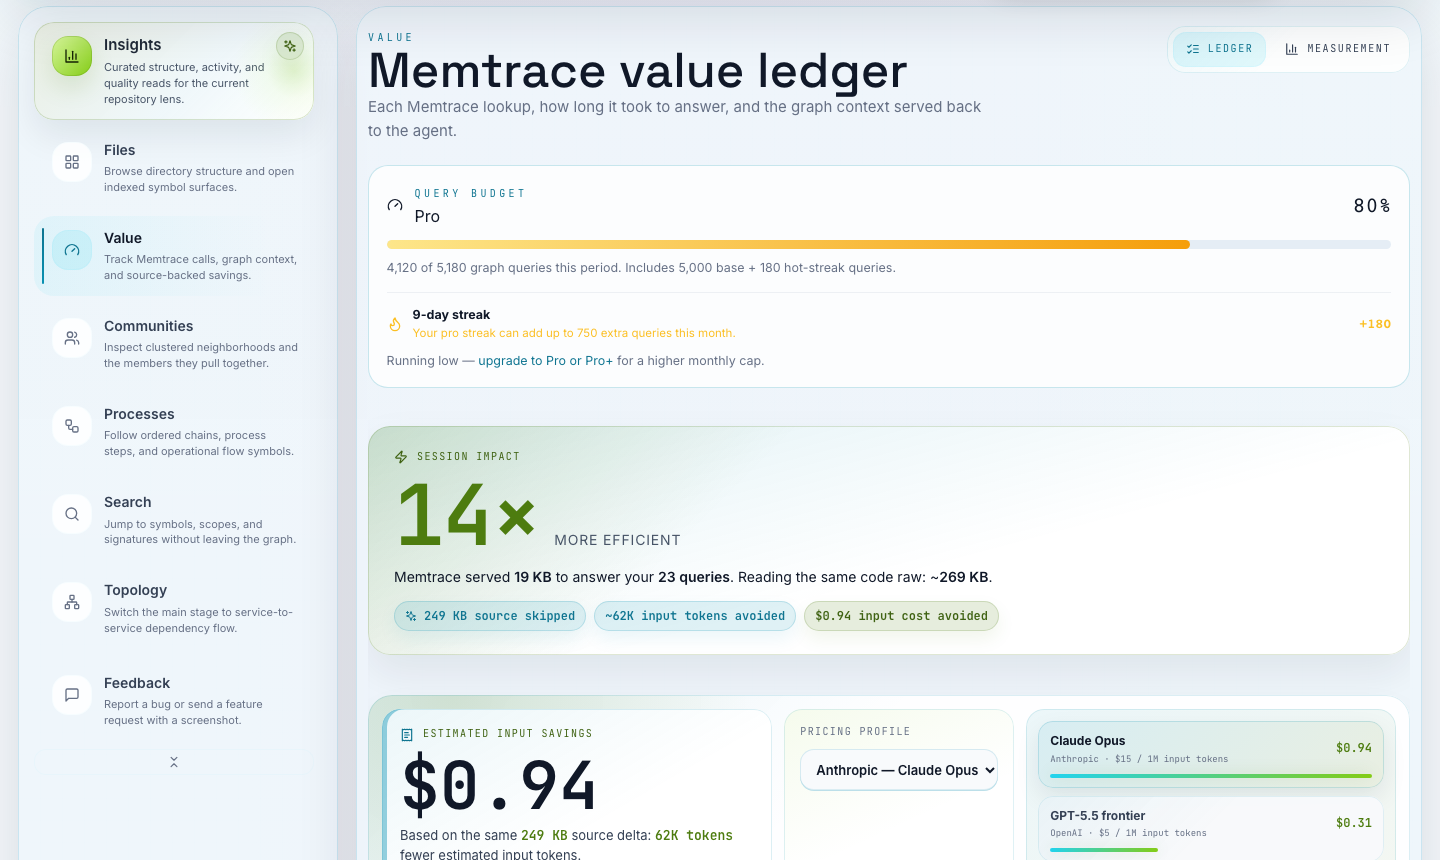
- Value — tracks Memtrace calls, graph context, and source-backed savings: a running ledger of the token/time value the graph is returning, backed by a persistent session + aggregate ledger.
- Communities — inspect clustered neighborhoods (Louvain communities) and the members that pull each one together.
- Processes — follow ordered call chains and operational flow symbols reconstructed from the graph.
- Search — jump to symbols, scopes, and signatures without leaving the graph view.
- Topology — switches the main stage from the code graph to a service-to-service dependency flow (API endpoints, outbound calls, cross-repo edges).
The canvas itself shows indexing-progress and engine-readiness banners while a repo is still being processed, kind filters to narrow what's drawn, and a node inspector panel for details on whatever you click.
Temporal timeline
Below the canvas, the temporal timeline lets you scrub through the graph's history — the same bi-temporal (branch × time) version history that backs get_evolution and get_timeline over MCP, but as a visual scrubber instead of a tool call.
How the Value counters and estimates increase#
The Value tab is backed by the persistent Memtrace tool-call ledger. It updates when an agent completes a value-relevant Memtrace lookup; the dashboard polls the current session every five seconds and also receives live ledger events. Fleet coordination heartbeats and other coordination/diagnostic calls are recorded for their own audit surfaces but are excluded from the Value query count.
| Metric | How it is computed |
|---|---|
| Queries | Count of value-relevant Memtrace tool calls in the selected session or ledger scope. |
| Measured Memtrace time | Sum of observed wall-clock elapsed_ms for those calls. It is measured, not synthesized. |
| Graph context delivered | Approximate byte count of the compact Memtrace responses returned to the agent. |
| Source-route baseline | Bytes from the resolved source files and bounded line windows an unaided agent would have needed to read, with overlapping windows merged. |
| Context reduction | max(0, source baseline − graph context) ÷ source baseline. A call that returns more context than its baseline does not create negative savings. |
| Efficiency multiple | Source-route baseline bytes ÷ graph context bytes. |
| Input cost avoided | Estimated input tokens reduced × the selected model input-token price. The model price can come from the live catalog or a user-entered custom rate. |
| Time returned | A raw-context processing equivalent derived from the measured context ratio and observed Memtrace throughput; it is not a promise of wall-clock time saved. |
A call can be valuable without having a defensible raw-source comparison. Metadata, history, API topology, and other derived answers still increase the query ledger, but source-backed byte savings are only credited when the response has a defined baseline. Older ledger entries created before elapsed-time or byte-savings fields existed still count as calls and contribute zero for the missing measurement.
The Value tab explains what Memtrace returned and how compactly. The query-quota meter counts billable tool calls against a plan. A non-billable lookup can appear in Value, while Fleet coordination calls appear in neither Value queries nor plan usage.
Insights#
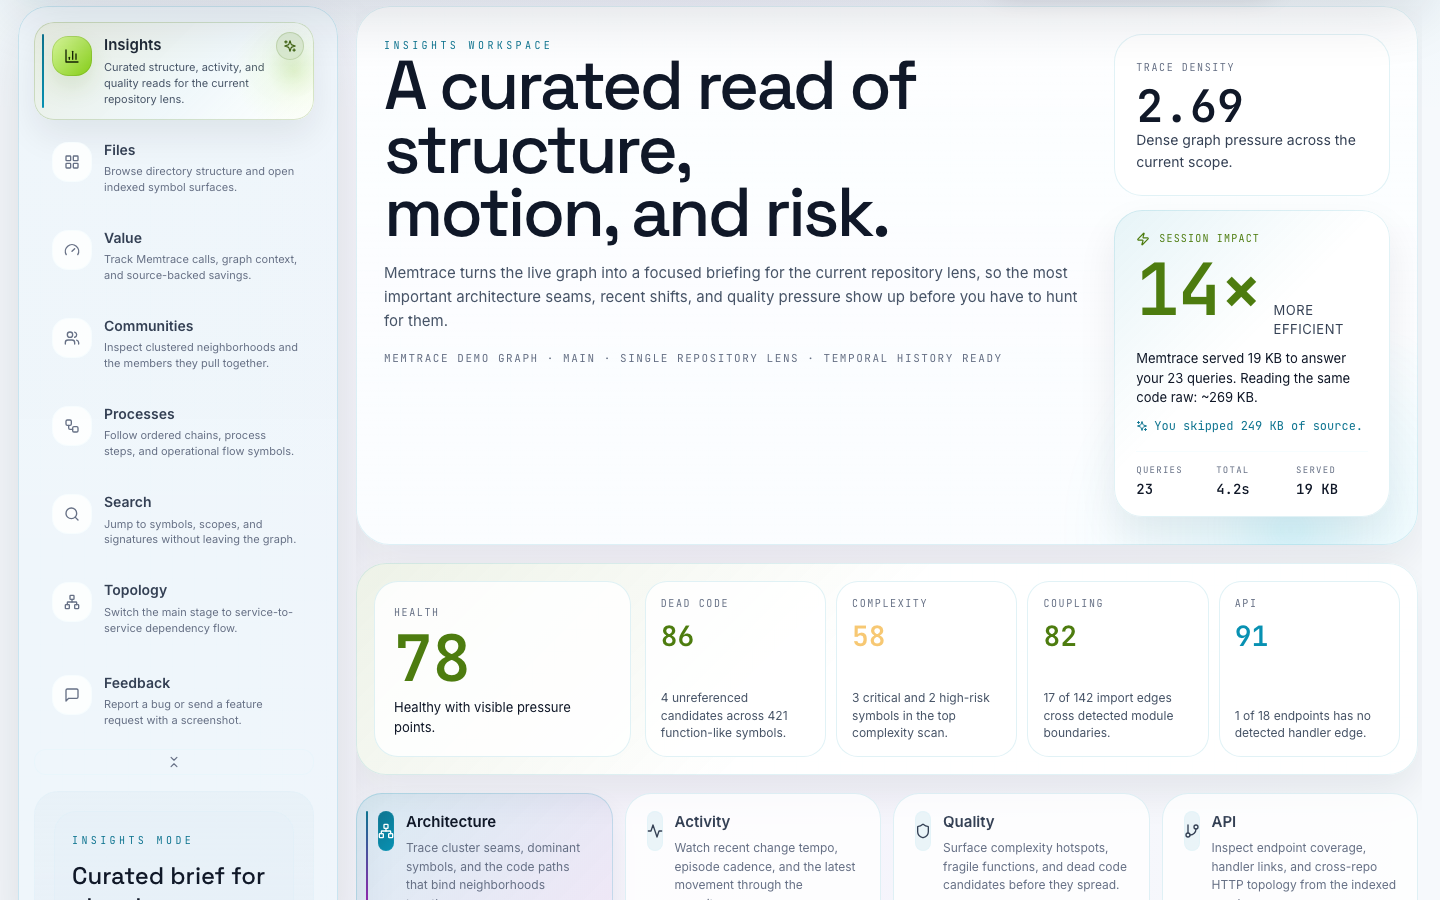
Insights is an editorial, four-tab briefing over the same graph — architecture seams, change tempo, risk surface, and API hygiene — plus a health widget and a session-efficiency tracker.
- Architecture — cluster seams and dominant symbols: where the graph concentrates weight and where boundaries are being crossed.
- Activity — change tempo and episode cadence: whether the repo is quietly compounding or actively churning.
- Quality — complexity hotspots, fragile functions, and dead-code candidates: the risk surface.
- API — endpoint coverage and cross-repo HTTP topology: where product flows cross service boundaries.
The health widget's "Exact duplication" figure counts duplicated function bodies found by the same scan behind find_duplicate_code: exact normalized-body matches only (near-duplicates are not measured), over production code on the repository's current branch — tests excluded, current code only. Each clone group contributes its copies beyond the first original, and a declaration the graph holds more than once still counts as one site, so the figure tracks real duplicated bodies rather than raw scan rows. Zero shows as clear, anything above zero as worth review, and a failed scan shows as unavailable instead of a false zero. What counts as an exact duplicate is defined in Code quality & review.
For a local daemon running your own .memdb — the normal, default setup — Insights is fully unlocked from the start; there's no plan requirement to see it. The referral-gated path (two confirmed referrals: an invitee signs in, gets a license, and sends their first heartbeat) only applies to external/hosted-store deployments that don't own their own local database.
Fleet control room#
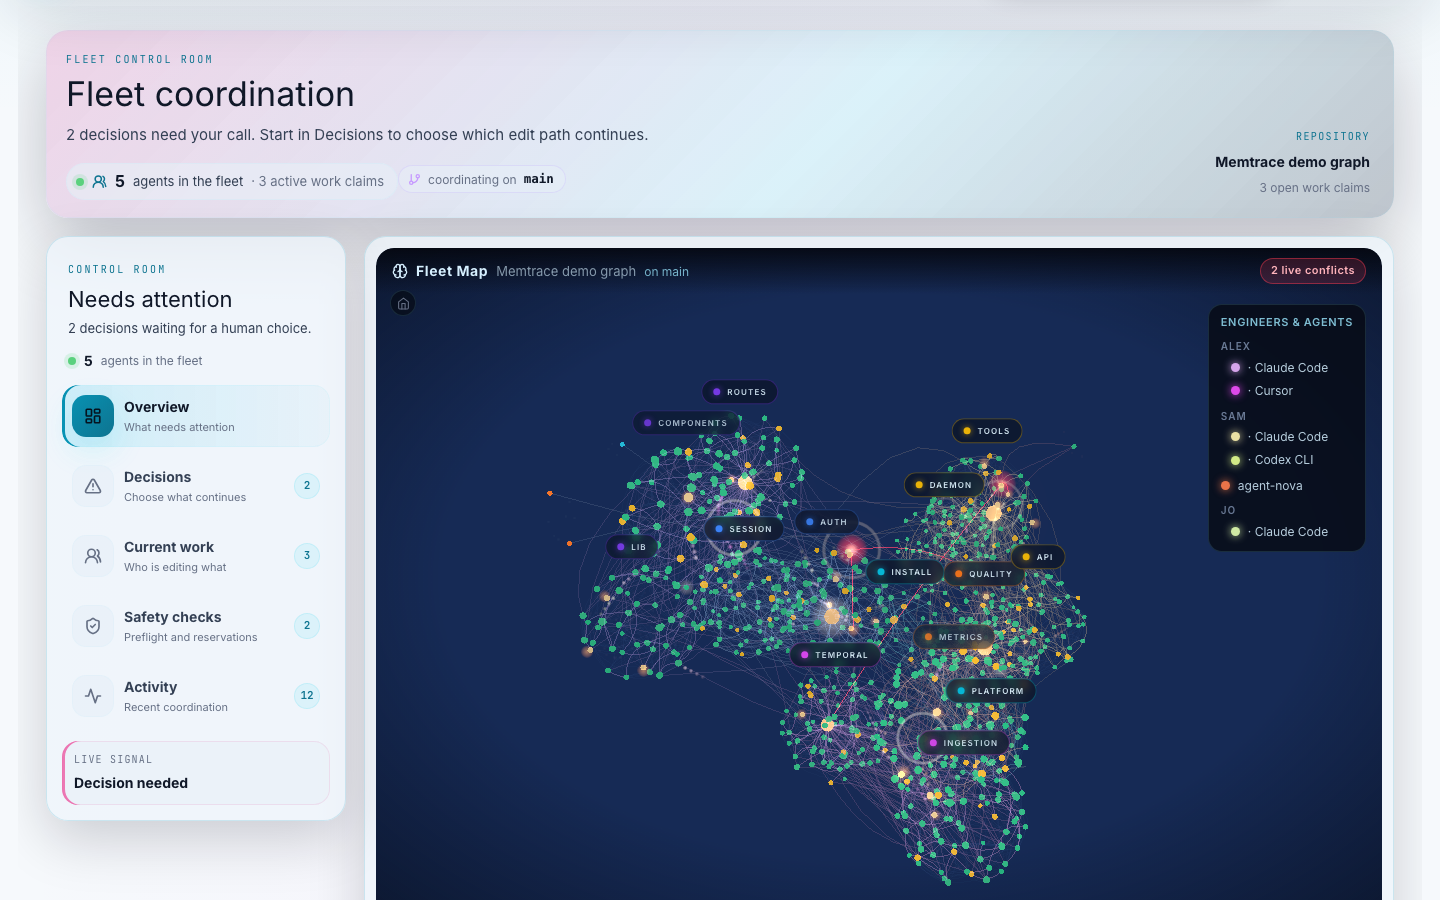
The Fleet page is the dashboard face of Memtrace's multi-agent coordination layer: a 3D fleet map as the overview, plus four classic sections underneath — decisions, work, safety, and activity. The activity section prefers the durable coordination audit trail; against an older daemon that predates the audit endpoint, or history recorded before it, it falls back to recorded episode history instead of going blank.
Cortex#
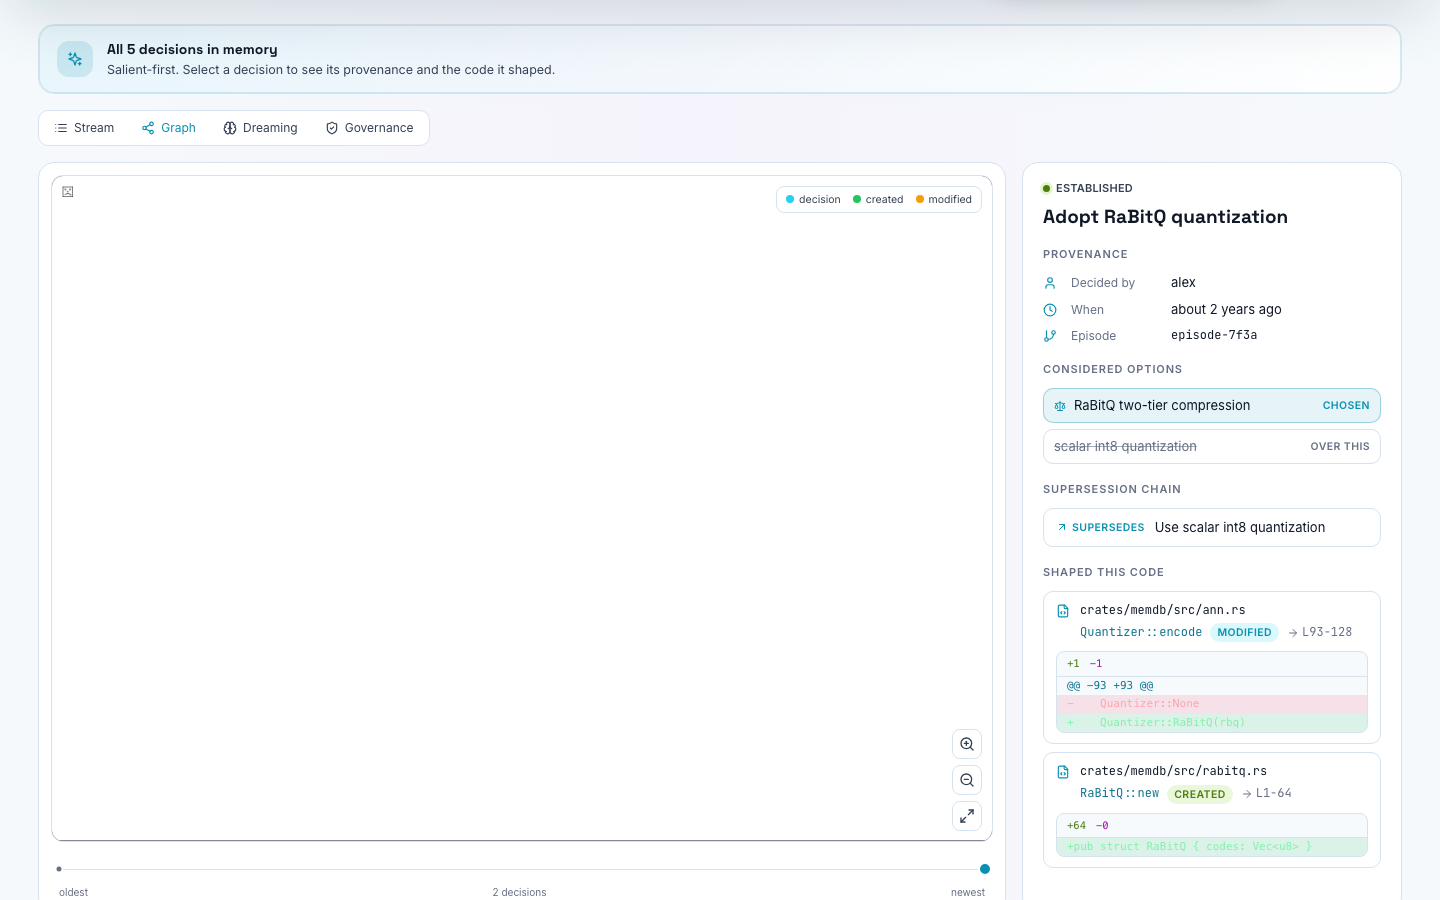
The Cortex tab is the decision-memory workspace — distinct from the Explorer's code/git graph. It renders a decision stream, a decision detail view, a timeline, a dedicated Cortex graph (a WebGL force-directed layout of decisions and the files they shaped), a diff view, a dreaming panel, and a cap banner. The 3D scene also branded "Cortex" is a separate thing — it's the Fleet page's Overview, a three.js "living brain" view of the fleet.
The query-quota meter#
A query-quota meter is built into the dashboard so you can see plan usage without leaving the UI. It counts billable graph-query tool calls against your plan's monthly (and, on Community, daily throttle) allowance — the meter only counts calls, it never ships the contents of your queries anywhere.
